Geodat: A Cartographic Data Base For Petroleum Mapping
By
Professor Michael Mainelli
Published by Communications of Harvard Computer Graphics Week, Harvard Laboratory for Computer Graphics and Spatial Analysis (July 1982).
Abstract
Geodat is a project which provides computer usable cartographic data for the petroleum industry. The data is primarily medium-scale (1:100,000), and contains digitised coastline and hydrography, international and internal boundaries, primary transportation routes, and city locations. The data is intended to be used on its own to produce quick, cheap, consistent maps for exploration. It will be used in conjunction with data bases of other cartographic features, wells, concessions, fields, geophysical surveys, and digital terrain models. This paper outlines the product the project provides, the product’s intended use, the importance of the project within the petroleum industry, and perhaps outside the petroleum industry.
I) Petroleum
The petroleum industry is huge. Individual companies in petroleum exploration and production are the largest in the world. The industry is a vast collection of companies engaged in many activities; seismic exploration, geological exploration, drilling, pipelines, tankers, refining; also computers, data bases, mapping; and of course, gas stations.
Any industry of such size generates tremendous amounts of information. Every year over 100,0001 wells are drilled, 1,000,0002miles of seismic information gathered, and billions of barrels of oil (not to mention gas), pumped, shipped, refined, shipped again, and used. Petroconsultants (PC) gathers information on the petroleum industry excluding only the US, Canada, and the Communist Block, distributing the information in reports and data bases. The data bases alone contain information on 25,000 wildcat wells, over 5,000 producing fields, and over 4,000 active concessions.
II) Petroleum Mapping
Great quantities of this information can be succinctly put and more effectively used in graphical form, particularly maps. However, in the oil industry, even reducing information is a large scale operation. The American Association of Petroleum Geologists3estimates that 1,000 to 1,500 computer maps are requested daily by petroleum geologists. Various estimates of the total number of maps of any kind made daily in the petroleum industry are as high as 10,000. Estimates based merely on a few necessary maps per well, field, and seismic survey would indicate that better than 3,000 maps are produced each day.
Oil companies use computer graphics for mapping, seismic analysis, planning pipelines, designing rigs, etc. Automated mapping on its own has been beneficial enough to justify independent computer graphics mapping machines to some firms. Oil companies have a need for cartographic data bases (CDBs) and the wherewithal to use them. There are three broad categories of petroleum computer maps: exploration maps, planning maps, and statistical maps. No category is exclusive, nor can any category be rigorously defined. It is merely a helpful way of grouping maps by their content and use.
Statistical maps are familiar thematic maps which present geographically dependent information in graphical form, e.g., a shaded map representing the estimated oil reserves in South American countries. Planning maps can be rudely defined as accurate cartographic maps smaller than 1:200,000, in practice larger than 1:50,000. These maps are used for planning specific projects, and may be use directly in the field, e.g., specifying survey lines, location particular wells, showing road access of water access, elevations and depths.
In the future, petroleum computer mapping will be more active in cadastral mapping, refinery mapping, terrain modelling, and satellite mapping, including analysis and cross-checking of non-graphical data bases using CDB interpretations. However, for the present, there remains a large need for utilitarian cartographic data, and a way to obtain it easily.
III) Geodat
PC is attempting to fill this need with the Geodat project. The project concentrates on providing computer usable exploration maps, though planning and statistical maps can be derived. Four files are delivered to participants, SEGMENT, MAP, ANNOTATION, and SET files.
The Project:
- Researches suitable exploration base maps internationally; information on all maps used is given on MAP records.
- Provides CDBs from such maps, nominal scale 1:100,000, including:
- SEGMENT records of digitised hydrology, bathymetry, coastline, boundaries, cities and transport.
- If requested, land cover, petroleum use, more detail from "SEGMENT"
- ANNOTATION
- SETS, groupings of "SEGMENT" into geographical features
- Provides facilities to exchange, reformat, or enhance existing CDBs. The Geodat format can be used as a standard for CDB exchange in the oil industry.
IV) Chronology
The historical background to the project provides an interesting case study in computer mapping and explains many of the reasons for the approaches taken. Here follows a brief outline of Geodat’s history:
1977– PC acknowledges and researches the importance of computer mapping. Company purchases a turnkey mapping system for internal use and aid in producing Foreign Scouting Service 1:1,000,000 maps.
1978– PC markets Chevron’s DMD (digital map data, over half of the world’s coastline, rivers, and boundaries at 1:1,000,000) and also acquires World Data Bank II for internal use.
1979- -PC develops seismic processing system with substantial cartographic work devoted to shotpoint map projections.
1980– PC develops field digitising system containing outline of North Sea fields, continues work on in-house editing and display capabilities, begins digitising services seismic/topographic. Now able to produce, with reasonable facility, good 1:1,000,000 maps of any area in the world showing concessions, field, wells, coastline, hydrography, boundaries, and special overlay digitising.
1981
April – Houston, initial presentation of Geodat to data base clients. They desire the service but have doubts about the size, complexity, and ability to get such a large project running. Decision to define size by number of points digitised.
June – PC completes full specification of Geodat, data formats, classifications, operating procedures, required system, and cost. Specifications mailed to clients.
August – Geneva, general meeting with clients to discuss Geodat. PC presents sample data demonstrating capabilities. Extremely positive response and formation of an eleven member paying advisory committee to refine the project in accord with petroleum industry needs.
October – PC completes an advisory committee specified benchmark and completely redraws specifications. Advisory committee has emphasised the importance of the base map to the digitised data, determined the projects map scale range (1:50,000 to 1:250,000), expanded the classifications, and agreed on the type and amount of digitising to be done from each map.
November – Dublin, general meeting of the advisory committee which approves the benchmark and begins work on commercial agreements.
December – PC begins a digitising service to Geodat specifications.
1982
February – Houston, general meeting to define commercial arrangements and prepare a general contract.
30 April – deadline for clients wishing to participate.
June – Geodat begins full-scale CDB production.
V) Description of the product
A) Commercial Organisation
At 1:100,000, approximately 15,000 maps would be necessary to cover the world's land. The effort necessary to complete the general digitising is estimated to exceed 500 man-years. Although many areas (e.g. for petroleum firms, those outside sedimentary basins) can be excluded, there are over 3,000 maps of relatively high interest. Due to so many maps, the project’s size must depend on the number of sponsors and their interests. It is a co-operative effort between PC and the clients. The following description assumes six sponsors.
For a fixed yearly fee, the sponsor receives a guaranteed six million digitised points per year and copies of all maps used (three hundred to four hundred). From the six million points the sponsor chooses areas to be digitised which use about 875,000 (6,000,000 (number of sponsors+1)). PC researches available maps, the sponsor approves the maps, PC acquires and digitises the maps, and all sponsors approve the digitising. The remaining million points are used by PC at its own discretion, e.g., to complete areas which have been underestimated, to acquire more detail. Although each sponsor receives six million points he/she is not told who requested what.
B) Source Map selection and Use
- source maps must be between 1:50,000 and 1:250,000
- the 48 contiguous states of the US are excluded from Geodat
- sponsors may provide their own maps
- certain minimum features must be taken from all maps
- sponsors may request additional features than those for 4
- digitising is done from stable film base whenever possible
C) Files provided on tape (figure 1)
- SEGMENT file
- segments are strings of longitude and latitude co-ordinates representing locations on the surface of the earth
- segments have a header giving attributes e.g., classification
- segment identify the map (or source) from which they come
- segments start and end at nodes, they must meet at nodes
- no segment may end in the middle of another segment (see d)
- coincident segments contain the same points
- segments join at nodes across map boundaries
- interpolation will be used to achieve similar point density throughout the project. Thus, information digitised from 1:250,000 maps will contain interpolated points to achieve 1:100,000 point density
- all points must be within 1 mm of the source map position
- ninety percent of points must be within 0.3 mm
- enough points must be digitised to adequately represent the line. No location on a source map feature is more than 0.5mm along the perpendicular joining the preceding point and the succeeding point in the sequence description feature.
- MAP file (applicable to any source, other CDB’s, hand input, etc)
- map records describe individual maps as completely possible
- map records tell how the map was acquired, published, etc.
- map records describe the projection used, scale, etc.
- map records hold the limits and extent of the map
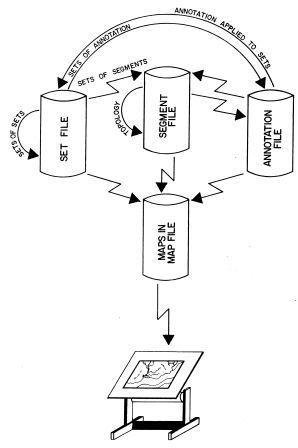
Figure 1 - Outline of Geodat file relationship
- ANNOTATION file
- annotation records describe labels on source maps
- annotation identifies the map (or source) from which it comes
- annotation contains source scale size, font, angle, etc.
- annotation had classification and points to a segment or set
- annotation had an equivalent point value
- SET file
- set records group segments, annotation, and/or sets together (e.g., the Nile river is the set of segments of the banks)
- a set identifies the map (or source) from which it comes
- a set has classification
- sets can have their own attributes
- sets have an equivalent point value
D) System used
The project software was written in FORTRAN for a PDP-11, but is being used on a Digital Equipment Corporation VAX 11/780. The software performs all digitising, editing, display, and output of the data to tape. Software development continues, and since transferral to the VAX, re-development and enhancement has been done in PL/I. It is intended to provide a machine independent system written totally in PL/I in the near future, although software sales continue on FORTRAN. The VAX is used with Summagraphics ID-48 and ID-60 free cursor digitisers, Tektronix 4010 and 4014 tubes, a Calcomp 970 plotter, and a Houston Instruments plotter.
The backbone of the system is the software and the method in which the digitising is handled. All digitising is on-line, but without the use of a graphic screen, i.e., blind digitising. The acquisition of the map records and proper pre-editing provide the ability to cross-check the work combined with automatic topological cross-checks and joining. At no time is anyone allowed to perform interactive graphic editing. The data may, in fact must, be viewed, overlaid, have attributes changed, or whatever, but no point may be moved to “make things look nice”. Graphic editing is done by re-inputting the feature- you must put the map back on the digitising table. Most of the topological checks and mass-editing functions can be performed either in batch or interactive mode.
Immediate future plans are to give all terminals (VT100’s) graphics (RETROGRAPHICS), expand disk capacity to more than 500MB, purchase laser line-following digitisers, and upgrade to Tektronix 4113/4114 or similar tubes.
E) Classification, attributes, other services
Seven digit classification codes are used throughout the project. These codes were compiled after looking at the USGS classification scheme and those of some clients. The coding system is easily expandable and allows for description of features for which only partial information is available.
Each segment, annotation, and set record can have an attribute card. This provision allows features to be fully described when the description is not contained in the classification. For instance, classification of a railroad by digit is as:
- (3) cartographic/geographic feature vs. geologic et al
- (5) transportation system vs. water et al
- (2) railroad and tracked transport vs. road et al
- (1) railroad vs. funicular/cable car
- (1) single vs. multi-tracked
- (2) local vs. main
- (0) unused.
Should any of the above be unknown they revert to 0. Thus to classify a suburban railway, the above (352.1120) would be sufficient. To classify a railway feature on a map for which no other information was known, (352.1000) would be used. However, nowhere in the classification scheme is the carriage width shown. This would be placed on an attribute card which could indicate:
- type of attribute – carriage width from which follow 2 and 3
- units of width – metres
- width – 7
- accuracy rating – 97 percent
Classification is necessary for easy and swift use, but unfortunate, because it can never be complete or specific enough to always translate into other schemes. Every attempt had been made to make it both expandable and usable over many possible source maps.
Geodat can provide a number of other services to clients. Digitising which is not part of the pooled data can be done to pooled data specifications. Extensive map libraries and map information is available, as well as expertise gained from dealing a wide variety of sources. Previously digitised data can be reformatted and enhanced to meet most Geodat specifications. Reformatting means that resale is more possible, and PC maintains a list of possible CDB sources on areas which have already been digitised.
VI) End-user input
Client contributions to the project were substantial. Without the suggestions offered by clients the system would not be as comprehensive or consistent. Client contributions were based on two points; first, the kind of maps and information they wanted; second, the format the information should have. By providing prospective clients with the proposed format, their questions focused on important end use points, which were left to PC to implement.
PC’s clients changed a large number of pre-conceptions that PC had used when designing the project. Three revisions of the output format changed such things as the way projections were encoded, the point accuracy, annotation requirements, key construction, and required national identifiers with every record. PC also changed a number of pre-conceptions that the clients used in evaluating the project. Most importantly, PC insisted on an output format which encompassed more than what was necessary. A strong distinction was drawn between what the output format could handle and what it would handle. The format was separated from the data which would be digitised, after everyone was satisfied that it could handle all projected digitising.
PC had to have the clients define the type of maps which were suitable for the project and what features were to be digitised from them. The clients had a variety of different uses for the data. Amongst themselves they had to decide what uses were more important. The clients were engaged in varied areas (Indonesia to the North Sea) in varied operations (offshore and onshore). For instance, there was a constant trade-off which arose time and again between contour lines and the extra time required to put contour data in the database. It was pointed out by one client that contour data would be acquired by the survey crews, implying that their computer maps would only be used only after the surveys were completed. The counterpoint was the contours could be necessary to plan surveys, especially offshore, and some clients only wanted digitising of costal features (except of course…). The end result was that the project digitises bathymetry which appears on topographic maps. Detailed bathymetry is left for another effort.
The importance of the benchmark cannot be overemphasised either. The advisory committee picked a sample area for which there were known maps. PC digitised and provided the maps and data to clients for evaluation. Through this procedure most remaining shortcomings in the project were found and corrected. It also proved PC’s abilities in computer cartography to clients.
Thus, client input in the planning process had two major benefits; first, the end product was more in tune with petroleum industry needs, and hence more saleable; second. PC was able to design a system that was based on broader lines than a single company would normally use.
VII) Describing a CDB
The most difficult part of selling CDBs is describing, in exact terms, what the data base comprises. From the CDB a user must draw various countries, decide what or how features are to be drawn or classified, determine the accuracy of the representation, and understand the data relationships. Part of the chosen solution was to describe the volume of the data base by the number of points it contained, eve where ‘points’ is inadequate, i.e., annotation and sets. ‘Points’ is even slightly inadequate when describing points. The volume of data when every two points has a header (e.g., DIME file), is substantially different from that when points are grouped into chains, and different again from less complex chains, polygonal encoding, etc. However, the solution worked in practice.
Another similar descriptive problem is that of the amount of data which will be taken from each map. If all of the annotation is to be acquired, so be it; but if only some annotation is to be acquired, what criteria are to be used? Likewise, how much detail will be necessary; will the database hold all rivers, double-banked rivers, only named rivers? These descriptive problems were approached in two steps. A classification scheme was attempted for all features. After the classification was devised, features and annotation were to be included or excluded by their classification. To date, no satisfactory method of describing the amount of annotation or detail has been advised. Although the clients desired a quantifiable description, they were unable to provide one themselves, and everyone settled for subjective decisions during pre-edit.
The importance of the source document or map is paramount in Geodat. All records in the data base point to the document from which they came. This contrasts with the way features are handled in other CBDs, most notably World Data Bank II. There are a number of advantages to recording the source of every feature and even some compelling necessities. By knowing exactly where every feature originated you can:
- always easily check the quality of the digitising;
- functionally group your information. The cartographers have done substantial work before you in placing their maps, now you can use it to subdivide you work, establish reasonably sized partitions, group things which are likely to affect each other, etc;
- have a reasonable way to organise updates;
- have a source to settle disputes.
It has become a dictum in most data bases that, where there is likely to be more than one source for information, sources should always be recorded. It is about time that the primacy of the source was a dictum for CDBs as well. The sources for Geodat vary; any number of different map agencies; any number of different map agencies, data bases of well locations, previously digitised information, and even hand-input of treaty boundaries. Knowing the source can affect the way the data is handled. For example, you could edit digitised lines so that they met, but when a digitised line met a hand-input treaty line only the digitised line should be editable.
Yet another descriptive problem is that of determining how closely the CDB matches a source map. Of course, this is simplified by knowing the source map for any feature in the CDB, but a description that they ‘look okay’ has to be quantified. The client is concerned that a map that can be off by 200 meters can be another 100 meters off after digitising. Despite the client’s most fervent desires, there is no answer to the 200 meter error; and the 100 meter error can only be reasonably quantified, not eliminated. It is important to emphasise that this is again an example of the importance of the source document; your digitising is only as good as the maps you digitise.
Conventional research into map error estimation is based on bi- or tri-dimensional regression and an evaluation of the statistical indicators used in the method. This seems to be unwieldy in practice because it requires redigitising selected points, and comparing them with the original digitisation. Of course, there are significant problems in determining which selected points match which digitised points when not dealing with point features or feature intersections. The redigitisation has its own possible errors. It is a lengthy manual process, and the regression is a lengthy machine process. The problem of quantifying CDB accuracy against a source map remains unsolved in the practical world. Nevertheless, some attempt at error estimation is essential. Geodat relies on the descriptions in V.C.1. (i, j, k) and the built-in estimates provided by automatic joining. More research is being by PC into selective redigitisation and remeaning procedures using real double digitising.
What scale can I plot this CDB at? This question always seems to arise after the digitisation. Geodat is striving to provide uniform data in the 1:100,000 scale range. When two map series available in that range are equally distant, say 1:125,000 and 1:75,000 but not 1:100,000, the series chosen is dependent on coverage, accuracy and speed. When two series are not equidistant say 1:126,720, and 1:63,360, the closer, 1:126,720, is chosen. Given this criterion, CDB users are assured that the CDB is striving for its stated scale range.
In addition to source map criteria, all digitised maps at scales smaller than 1:100,000 (e.g., 1:250,000) have interpolated points to give them the same point density as a 1:100,000 digitisation. The interpolated points are marked so they may be removed, but they are provided. Maps at larger scales have points marked for generalisation. Interpolation and generalisation do not give anyone the ability to use the data at 10 times the scale of digitisation. They do provide the ability to be uniform, and the ability to take advantage of cases where uniformity was impossible, but the results are beneficial (e.g., series available was 1:50,000) Thus, although the detail may not be accurate, you can always plot the data base at 1:100,000 or smaller without jagged lines, and in certain areas you can plot the database at larger scales because you will know the source map scale.
VIII) Future of the Project
An acceptable exchange format for CDBs and graphics has been discussed for some time, and some preliminary specifications established, e.g., IGES. Nevertheless, a number of de facto standards exist, many of which are inadequate outside their field. Geodat’s format may be one of these. Geodat can become the de facto oil industry CDB standard, perhaps that is sufficient; however, it can be examined as a possible exchange format for digitised topographic map features. Geodat format has a number of advantages over traditional card formats, especially the attribute card provision. The major problem is that by having a classification system, it limits itself to cartographic data until the classification is expanded. Even when completed, any classification system is too rigid. The growth of Geodat as a standard will depend on expanding and standardising the attribute and the classification tables. Certainly however, the major file divisions, the attribute card approach, and the reliance on the source document are the basis for any reasonable exchange format.
Hand in hand with the success of Geodat as an exchange format is the software support for the Geodat approach over a wide variety of machines. The inevitable problems of machine independence are a long way from being solved, especially in graphics. Most necessary software will be available for the DEC and IBM within a year. But in the turnkey market, the interchange of data has been hampered by competitive divisions between manufacturers, and the interchange of software is close to nil.
Lastly, how viable (necessary in any business paper) is the role off a CDB project that concentrates on topographic maps? With the advent of instant map production from Landsat data, the future could be considered bleak. At present, the best Landsat maps that can be produced are smaller than 1:250,000. This would bode well for another earth resources satellite capable of producing maps at scales larger than 1:100,000, but such a launch is likely to be at least three years away. PC is doing its own research in this area and preparing for the day when the raw input to Geodat is not a source document but a source scan. However, the future looks set for up to five years, and the CDB manipulation capabilities which are gained over that period will still be useful long after there is not more hand digitising.
IX) Conclusions
The Geodat project provides a case study of the development of a data base by both the supplier and the supplied. The iterative approach used, narrowed the task, broadened the horizons, and involved the future users. The end result will be a CDB which is easily used for the production of topographic maps in the scale range specified. The Geodat format is also useable for any other scale range and many other feature types, basically any linear or point features found on maps from 1:100,000,000 to 1:100.
Perhaps the most important lessons are: (1) plan for expansion, look around, and then leave room for what you find; (2) plan around your least common denominator and most important unit, in this case – a map.
Bibliography
1)“Annual Forecast Review”, World Oil, Vol. 194, No. 3, (February 15, 1982) pages 121-246
2) “World Boom in Geophysical Action”, Petroleum Times, Vol. 85, No. 2143, (September 1981), page 8.
3) C.F. Inglehart, “Computer Applications Committee Cites Data Sources”, AAPG Explorer, (December 1981), page 10.
4) Mainelli, M.R. and Murray, T.J., GEODAT, Petroconsultants Ltd., Dublin, October 1981.
[An edited version of this article appeared as “Geodat: A Cartographic Data Base for Petroleum Mapping” during Harvard Computer Graphics Week , (July 1982)]